Introduction
In the world of finance, access to accurate and timely interest rate data is crucial for developers, economists, and financial analysts. The Federal Reserve's Discount Rate, a key indicator of monetary policy, plays a significant role in shaping economic conditions. This blog post will explore how to leverage the Interest Rates API to access historical data, perform time series analysis, and visualize trends related to the FED_DISCOUNT_RATE. We will cover various endpoints, provide code examples, and discuss best practices for integrating this data into fintech applications.
Understanding the FED_DISCOUNT_RATE
The Federal Reserve's Discount Rate is the interest rate charged to commercial banks and other depository institutions for loans received from the Federal Reserve's discount window. This rate is a critical component of monetary policy and can influence other interest rates in the economy, including those for loans and mortgages. By analyzing the FED_DISCOUNT_RATE, developers and analysts can gain insights into economic trends and make informed decisions.
Accessing Interest Rate Data with the Interest Rates API
The Interest Rates API provides a comprehensive suite of endpoints to access various interest rate data, including the FED_DISCOUNT_RATE. Below, we will explore the key endpoints relevant to retrieving historical data and performing time series analysis.
1. Retrieving Available Symbols
Before accessing specific interest rate data, you can retrieve a list of available symbols using the following endpoint:
GET /api/v1/symbolsThis endpoint allows you to filter symbols by category, base currency, and provider. For example, to get a list of central bank rates in USD, you can use the following cURL command:
curl "https://interestratesapi.com/api/v1/symbols?category=central_bank&base=USD&api_key=YOUR_KEY"The JSON response will include available symbols, such as:
{
"success": true,
"count": 2,
"symbols": [
{
"symbol": "FED_DISCOUNT_RATE",
"name": "Federal Reserve Discount Rate",
"category": "central_bank",
"country_code": "US",
"currency_code": "USD",
"frequency": "daily",
"description": "The interest rate charged to commercial banks for loans from the Federal Reserve."
}
]
}
2. Fetching the Latest FED_DISCOUNT_RATE
To retrieve the latest value of the FED_DISCOUNT_RATE, you can use the following endpoint:
GET /api/v1/latestHere’s how to fetch the latest rates for the FED_DISCOUNT_RATE and other symbols:
curl "https://interestratesapi.com/api/v1/latest?symbols=FED_DISCOUNT_RATE&api_key=YOUR_KEY"The response will provide the most recent rate:
{
"success": true,
"date": "2026-08-02",
"base": "USD",
"rates": {
"FED_DISCOUNT_RATE": 5.33
},
"currencies": {
"FED_DISCOUNT_RATE": "USD"
}
}
3. Historical Data Retrieval
For point-in-time lookups, the historical endpoint allows you to retrieve the FED_DISCOUNT_RATE for a specific date:
GET /api/v1/historicalTo get the rate for June 15, 2025, you can use:
curl "https://interestratesapi.com/api/v1/historical?date=2025-06-15&symbols=FED_DISCOUNT_RATE&api_key=YOUR_KEY"The response will include the rate for that date:
{
"success": true,
"date": "2025-06-15",
"base": "USD",
"rates": {
"FED_DISCOUNT_RATE": 5.33
},
"currencies": {
"FED_DISCOUNT_RATE": "USD"
}
}
4. Time Series Data
The time series endpoint is particularly useful for analyzing trends over a specified date range. You can retrieve daily rates for the FED_DISCOUNT_RATE between two dates:
GET /api/v1/timeseriesFor example, to fetch data from August 2, 2025, to August 2, 2026, use:
curl "https://interestratesapi.com/api/v1/timeseries?start=2025-08-02&end=2026-08-02&symbols=FED_DISCOUNT_RATE&api_key=YOUR_KEY"The response will provide a series of rates:
{
"success": true,
"base": "USD",
"start_date": "2025-08-02",
"end_date": "2026-08-02",
"rates": {
"FED_DISCOUNT_RATE": {
"2025-08-02": 5.33,
"2025-08-03": 5.33,
"2025-08-04": 5.34
}
},
"frequencies": {
"FED_DISCOUNT_RATE": "daily"
},
"currencies": {
"FED_DISCOUNT_RATE": "USD"
}
}
5. Analyzing Fluctuations
To understand how the FED_DISCOUNT_RATE has changed over time, you can use the fluctuation endpoint:
GET /api/v1/fluctuationThis endpoint provides statistics such as the start and end values, percentage change, and high/low rates over a specified range:
curl "https://interestratesapi.com/api/v1/fluctuation?start=2025-08-02&end=2026-08-02&symbols=FED_DISCOUNT_RATE&api_key=YOUR_KEY"The response will include valuable insights:
{
"success": true,
"rates": {
"FED_DISCOUNT_RATE": {
"start_date": "2025-08-02",
"end_date": "2026-08-02",
"start_value": 5.50,
"end_value": 5.33,
"change": -0.17,
"change_pct": -3.09,
"high": 5.50,
"low": 5.25
}
}
}
6. OHLC Data for Visualization
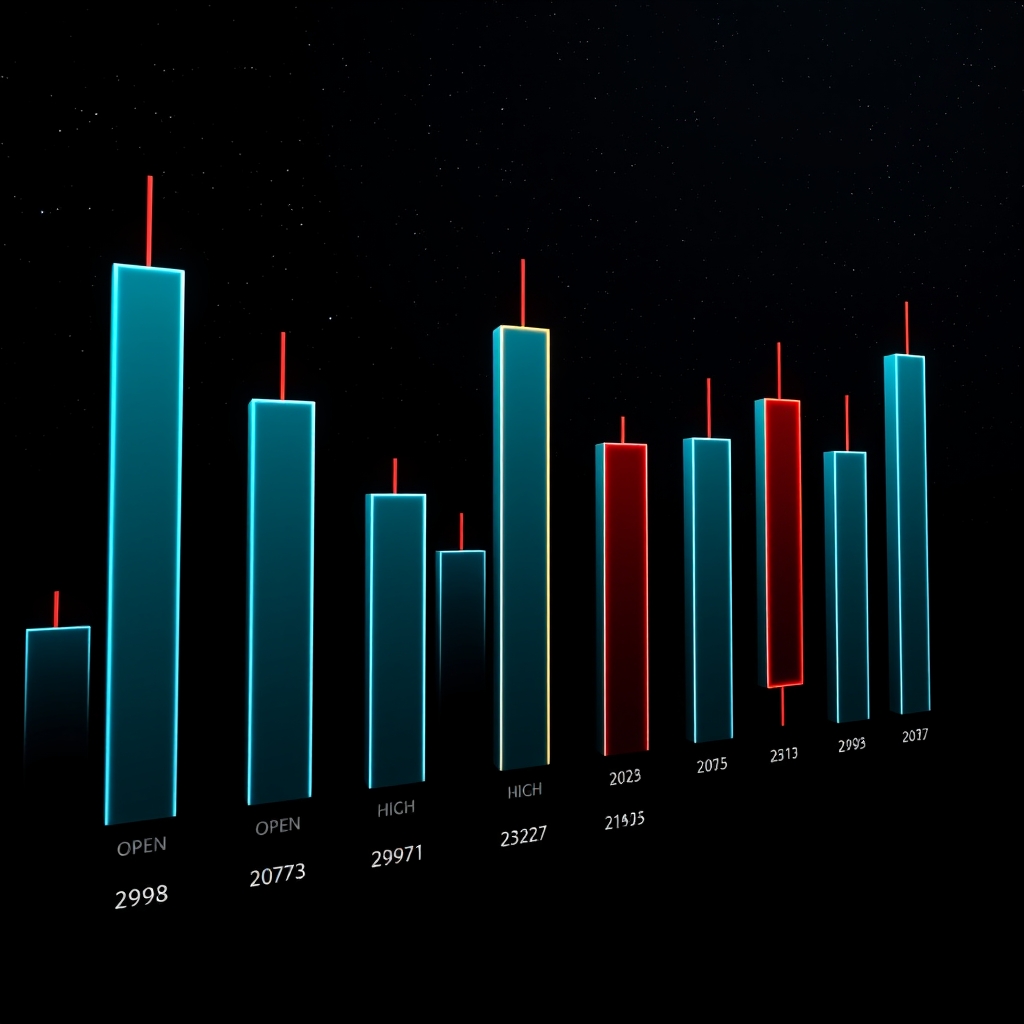
For those interested in visualizing the FED_DISCOUNT_RATE, the OHLC (Open, High, Low, Close) endpoint is essential. This data can be used to create candlestick charts:
GET /api/v1/ohlcTo retrieve monthly OHLC data, you can use:
curl "https://interestratesapi.com/api/v1/ohlc?symbols=FED_DISCOUNT_RATE&period=monthly&start=2025-08-02&end=2026-08-02&api_key=YOUR_KEY"The response will provide the necessary data for charting:
{
"success": true,
"period": "monthly",
"start_date": "2025-08-02",
"end_date": "2026-08-02",
"rates": {
"FED_DISCOUNT_RATE": [
{
"period": "2025-08",
"open": 5.50,
"high": 5.50,
"low": 5.33,
"close": 5.33,
"data_points": 23
}
]
}
}
Building a Data Pipeline with Python
To effectively utilize the FED_DISCOUNT_RATE data, you can build a data pipeline using Python. Below is a complete example that fetches the data, processes it into a Pandas DataFrame, and exports it to CSV or Parquet format:
import requests
import pandas as pd

# Fetch time series data
response = requests.get(
'https://interestratesapi.com/api/v1/timeseries',
params=dict(start='2025-08-02', end='2026-08-02', symbols='FED_DISCOUNT_RATE', api_key='YOUR_KEY')
)

data = response.json()

# Process data into DataFrame
dates = data['rates']['FED_DISCOUNT_RATE']
df = pd.DataFrame(list(dates.items()), columns=['Date', 'Rate'])
df['Date'] = pd.to_datetime(df['Date'])

# Export to CSV
df.to_csv('fed_discount_rate.csv', index=False)

# Export to Parquet
df.to_parquet('fed_discount_rate.parquet', index=False)
Common Pitfalls in Time Series Analysis
When working with time series data, there are several pitfalls to be aware of:
- Missing Dates: Ensure that your analysis accounts for weekends and holidays when the FED_DISCOUNT_RATE may not be available.
- Frequency Considerations: Understand the difference between daily and monthly data, as this can impact your analysis and visualizations.
- Data Points Interpretation: Be cautious when interpreting the number of data points, especially for monthly symbols, as they may not represent the entire month.
Conclusion
The Interest Rates API provides a powerful tool for accessing and analyzing the FED_DISCOUNT_RATE and other interest rate data. By leveraging the various endpoints, developers can build robust fintech applications that provide valuable insights into economic trends. Whether you are performing time series analysis, visualizing data, or building data pipelines, the Interest Rates API offers the flexibility and reliability needed to succeed in today's financial landscape.
To get started with the Interest Rates API, visit Get started with Interest Rates API and explore the features available to enhance your financial applications.